
Chinese applicants filed more than 21,000 invention patent applications in the United States in 2016, more than in any other overseas destination.
Except in the United States, Germany and the United Kingdom, Chinese applicants used the PCT route more often than direct filing for overseas invention applications.
Filings grew in many destinations, particularly India, Russia, Brazil, the United Kingdom, Indonesia and Vietnam, while filings in African countries fell substantially.
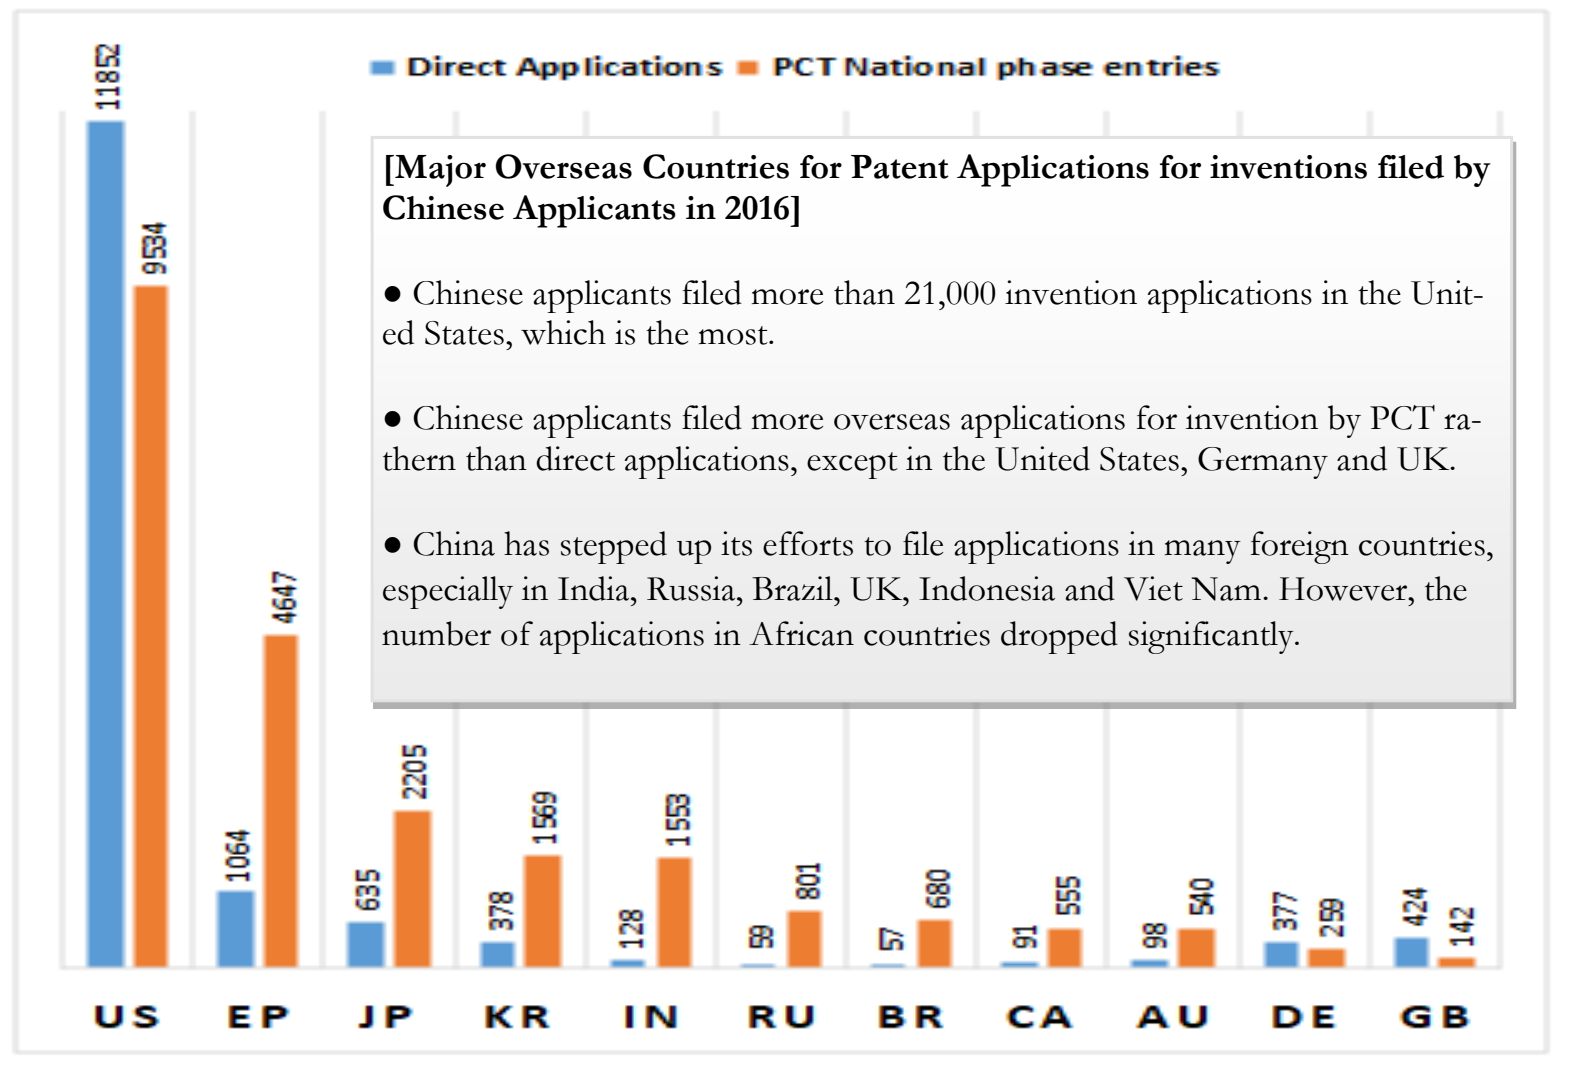
The comparison below gives 2015 and 2016 invention application totals and the percentage increase:
United States (US): 18,040 → 21,386; 18.55%.
European Patent Office (EP): 4,657 → 5,711; 22.63%.
Japan (JP): 2,531 → 2,840; 12.21%.
South Korea (KR): 1,572 → 1,947; 23.85%.
India (IN): 880 → 1,681; 91.02%.
Russia (RU): 598 → 860; 43.81%.
Brazil (BR): 559 → 737; 31.84%.
Canada (CA): 604 → 646; 6.95%.
Australia (AU): 593 → 638; 7.59%.
Germany (DE): 524 → 636; 21.37%.
United Kingdom (GB): 293 → 566; 93.17%.
Source: http://www.sipo.gov.cn/tjxx/