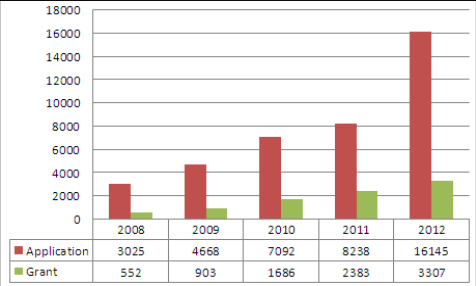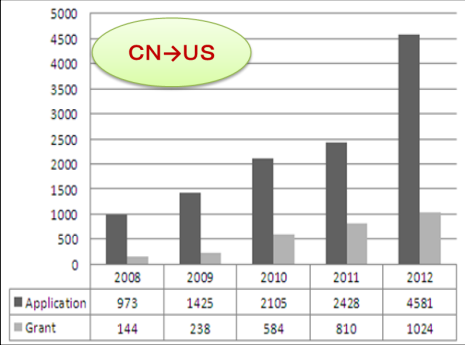
The following statistics show that, in recent years especially in 2012, Chinese patent filings abroad had a sharp growth. As shown in Figure 1, the number of overseas patent filings reached 8,238 in 2011. In the year of 2012, the number almost doubled, reached 16,145.
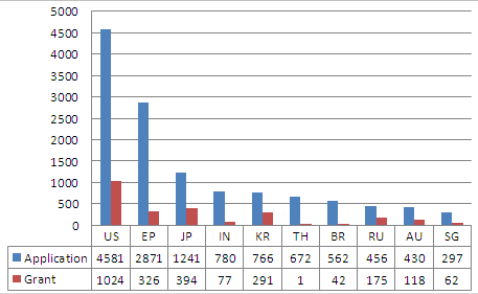
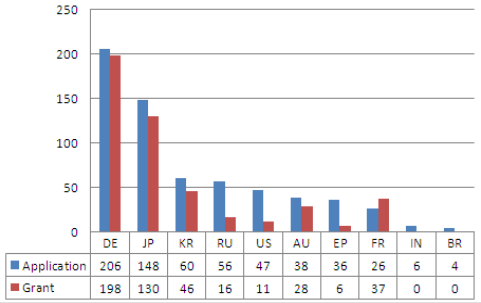
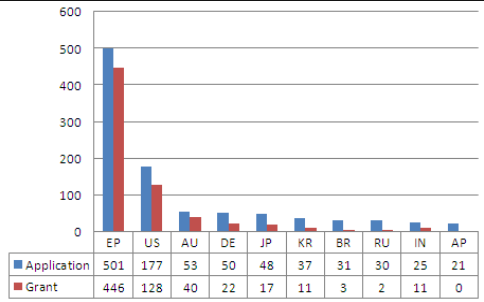
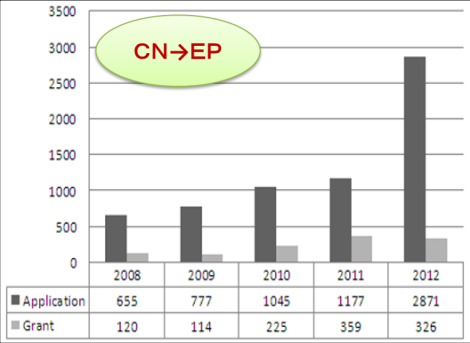
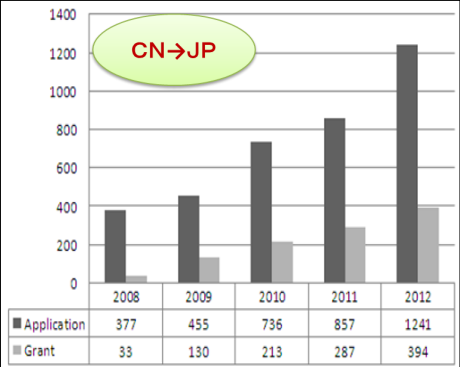
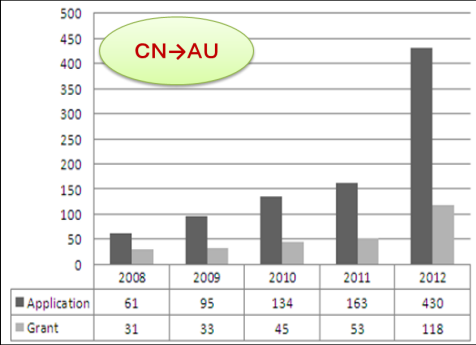
Figure 2 to Figure 4 show that the United States of America, Europe, Japan, Germany and India are main countries that the overseas applications are targeted. In addition, compared with the 163 filings in 2011, the total number of Australia patent applications filed by Chinese applicants had reached 430 in 2012, approximately 2.6 times the 2011 figure (see Figure 8). The number of patent applications filed by Chinese applicants with the EPO had reached 2,871 in 2012 compared to 2011, 1,177 filings, up approximately 144%.
Besides, merely 31 Thailand patent applications were filed by Chinese applicants in 2009. In the year of 2012, the number reached 632, around 20 times of the number of 2009.
Fig 1: Patent Application and Grant Abroad for Chinese Applicants (invention, utility model and design) Fig 2: Patent Application and Grant Abroad for Chinese Applicants 2012 (invention)
Fig 3: Patent Application and Grant Abroad for Chinese Applicants 2012 (Utility model)
Fig 4: Patent Application and Grant Abroad for Chinese Applicants 2012 (design) Fig 5: US Patent Application and Grant for CN Applicants
Fig 6: EPO Patent Application and Grant for CN Applicants
Fig 7: Japan Patent Application and Grant for CN Applicants Fig 8: Australia Patent Application and Grant for CN Applicants
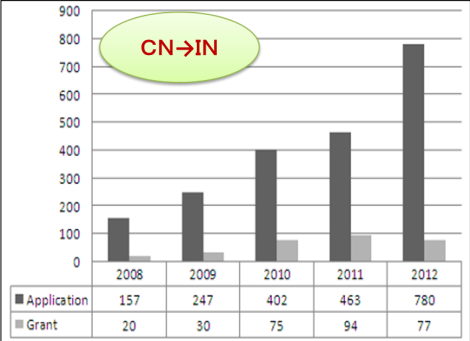
Fig 9: India Patent Application and Grant for CN Applicants
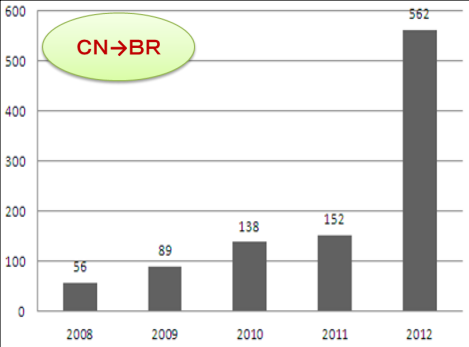
Fig 10: Brazil Patent Application and Grant for CN Applicants
Source: http://www.sipo.gov.cn/tjxx/