
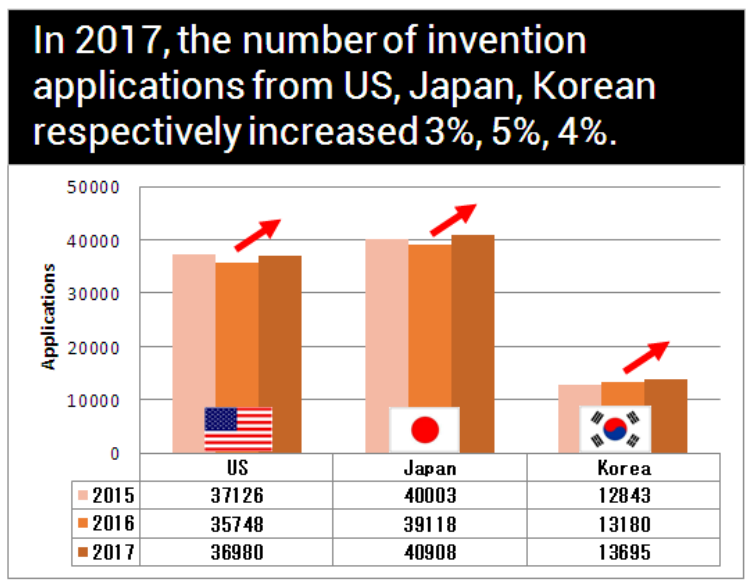
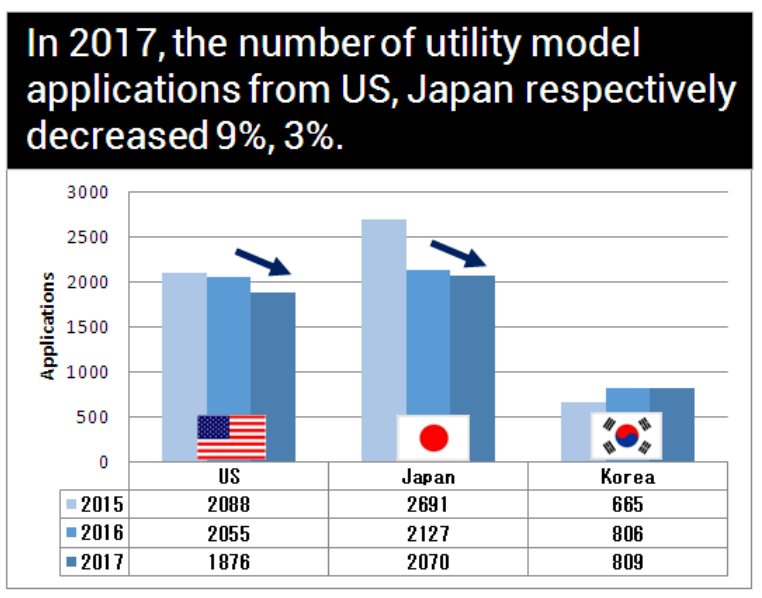
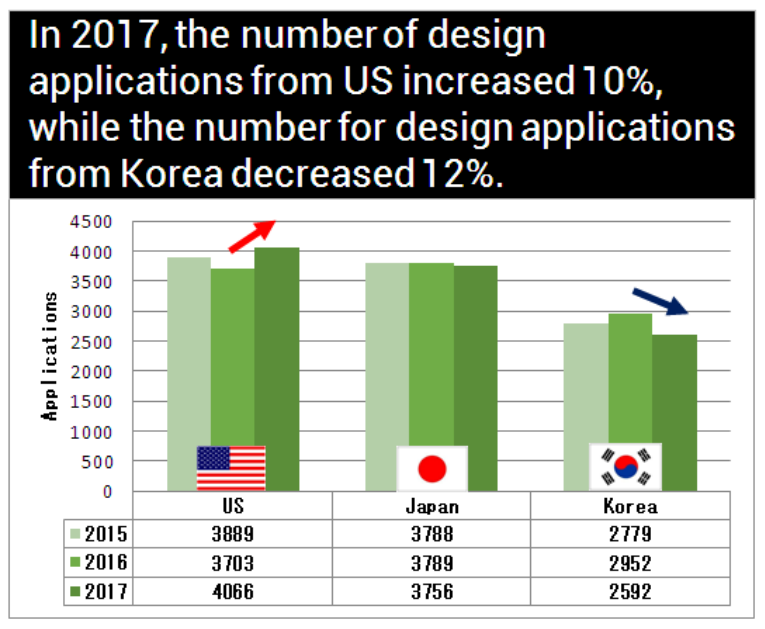
The charts compare Chinese invention, utility model and design applications filed by applicants from the United States, Japan and South Korea in 2015–2017.
Invention applications, in 2015 / 2016 / 2017: United States, 37,126 / 35,748 / 36,980; Japan, 40,003 / 39,118 / 40,908; South Korea, 12,843 / 13,180 / 13,695. In 2017, the respective increases were approximately 3%, 5% and 4%.
Utility model applications, in 2015 / 2016 / 2017: United States, 2,088 / 2,055 / 1,876; Japan, 2,691 / 2,127 / 2,070; South Korea, 665 / 806 / 809. US and Japanese filings decreased by approximately 9% and 3%, respectively, in 2017.
Design applications, in 2015 / 2016 / 2017: United States, 3,889 / 3,703 / 4,066; Japan, 3,788 / 3,789 / 3,756; South Korea, 2,779 / 2,952 / 2,592. US filings increased by approximately 10% in 2017, while Korean filings fell by approximately 12%.
Source: http://www.sipo.gov.cn/tjxx/index.htm